Open pit mines and tailings facilities are in a constant state of change. Engineers have a continual need for accurate elevation survey data to manage these dynamic sites safely and responsibly.
PhotoSat’s Mine Site Surveying ensures engineers get reliable, robust, and time-stamped survey data for the entire active area, without the need for site access.
The Mine Site Surveying package includes these standard deliverables.
Standard DeliverablesOptional Deliverables
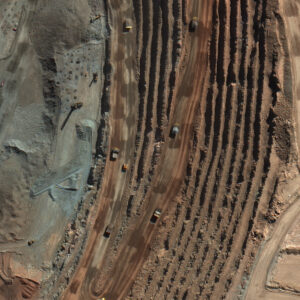
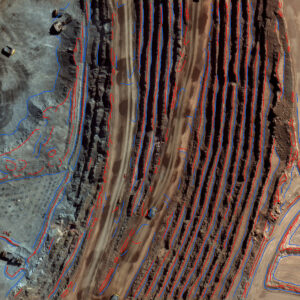
Precision Orthophoto
High-resolution orthorectified photo of your project area.
Resolution: as per satellite File format(s): ERS, JPEG, KML, LAS, PDF, PNG, TIF, and XML
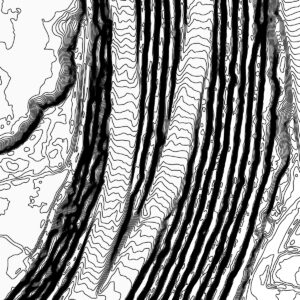
Contours
Available in 50 cm, 1 m, 5 m, 10 m, or custom intervals.
File format(s): DWG, DXF, KML, and SHP
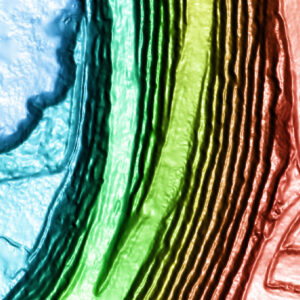
Colour Shade
Detailed 3D topography of your area with high elevations in warm colours and low elevations in cool colours.
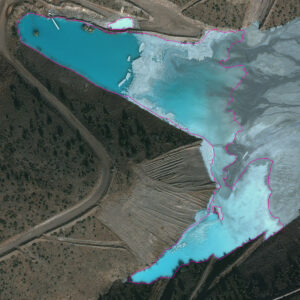
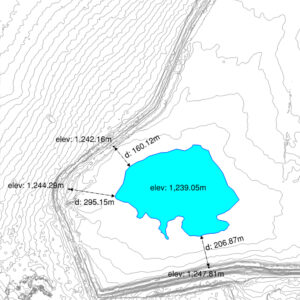
Water Body Outlines
Digital and geolocated linework of surface water including supernatant ponds, engineered tailings cells, naturally occurring water bodies, and/or seasonal accumulation.
Line: 1 pixel For water bodies 400 m2 or larger
Road Widths
Assessment of infrastructure compliance with road width measurements.
Defined as per client specifications
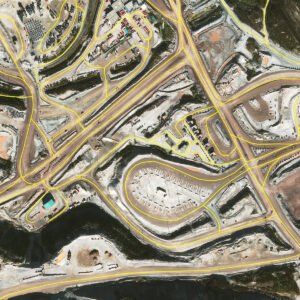
Road Edges
Digital and geolocated linework for centerlines and/or shoulders of roads within your site.
Line: 1 pixel
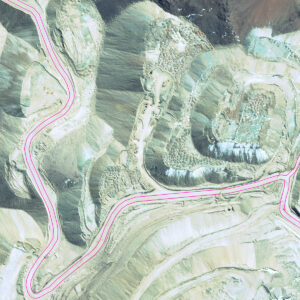
Road Centerlines
Digital and geolocated linework for road centerlines within your site.
Line: 1 pixel
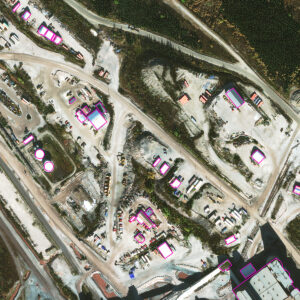
Buildings Outlines
Digital and geolocated linework of your site’s infrastructure, including buildings and engineered structures.
Line: 1 pixel
Toes and Crests
Digital and geolocated linework of break lines, such as benches in the pit.
Line: 1 pixel
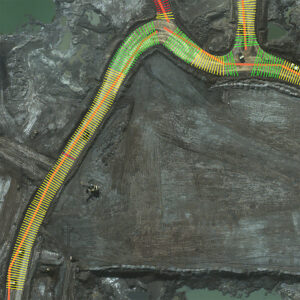
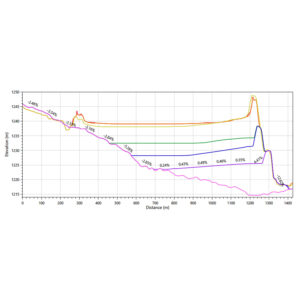
Beach Profiles
Time-stamped cross-sections showing the elevation and lift profiles of tailings beaches.
Cross-section(s): locations as per client request
Beach Lengths
Measured distance between the supernatant pond edge and tailings embankments.
Locations as per client request
Accuracy Study
How accurate is a survey produced from WorldView-3 satellite imagery?